The first piece of information, I present to parents, family members, students and administrators is overall reading readiness. Overall reading readiness is the most comprehensive and effective way to communicate a student's reading readiness. Each student's reading readiness is determined by the combination of his or her foundational reading skills.
easyCBM Overall Reading Readiness
The easyCBM overall reading readiness is compiled using the easyCBM metric once I've tested each student's foundational reading skills. I use the overall reading readiness scores, when determining guided reading groups for class and when sharing student's grade-level reading readiness with administration, students and family members.
Computer Generated Reports
The evidence displayed below are computer generated reports for teachers and family members, classifying students by percentile ranking and risk category. As a an educator, I use the risk category to parallel the structure of below grade level (high risk [red]) , less than on level below grade level (some risk [yellow]) , and on or above grade level (low risk [green]). The computer generated summary or report allows families, administrators, and myself as an educator to gain a visual understanding of each individual assessment and the data of the class in each time frame BOY, MOY, and EOY.
easyCBM Scoring Charts
The two scoring charts below provide the teachers, students, educators and family members with a comprehensive key to interpret student data. EasyCBM scoring chart # 1 explains provides a comprehensive key for the color coding system for the easyCBM assessment and easyCBM scoring chart #2 provides an more detailed explanation for of numerical values and their percentile ranking, respective to the testing window, including fall (BOY), winter (MOY), and spring (EOY).
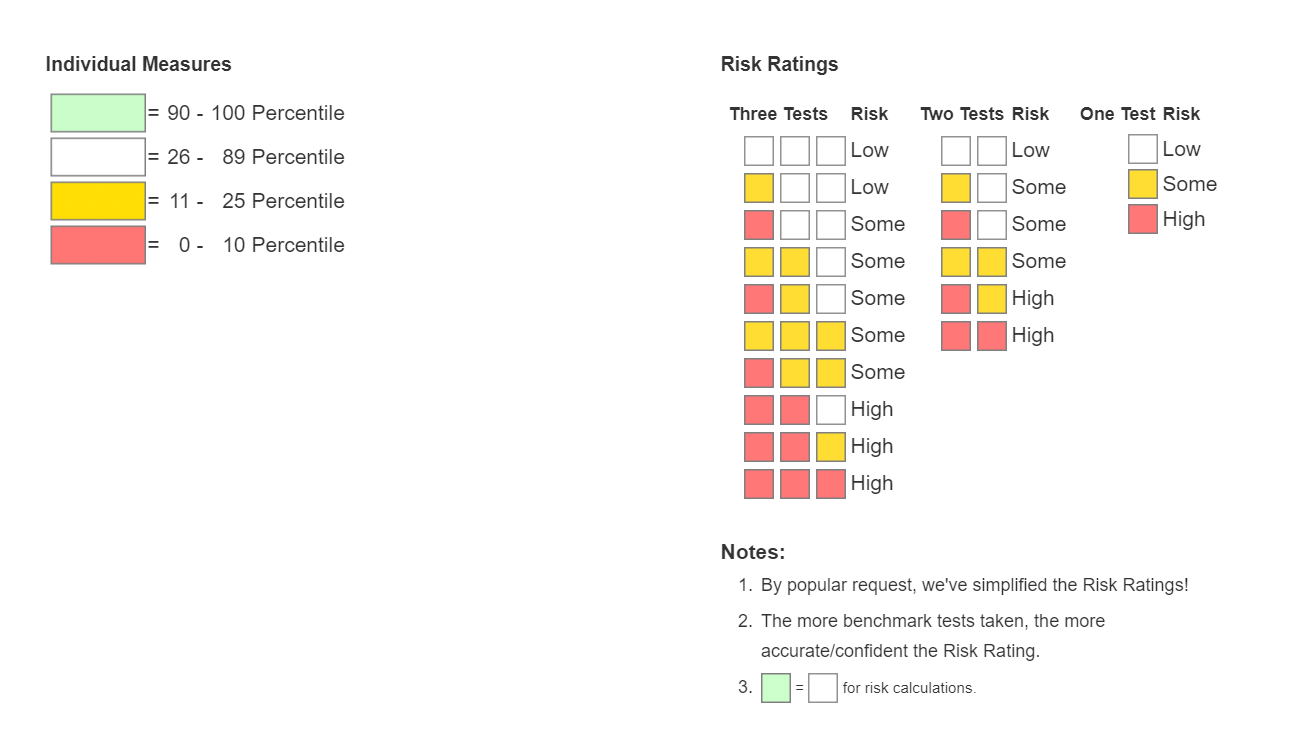
easyCBM Scoring Chart #1
On the easyCBM assessment, student scores are colored coded using a four color system illustrating risk calculations. As illustrated in individual measures on the left side of the image above, green (low risk) = 90 - 100 percentile, white (low risk) = 26 - 89 percentile, yellow (some risk) = 11 - 25 percentile, and red (high risk) = 0 - 10 percentile. Students risk ratings are determined based on the risk ratings calculated by all three assessment scores. The risk rating system is illustrated on the right side of the image above.
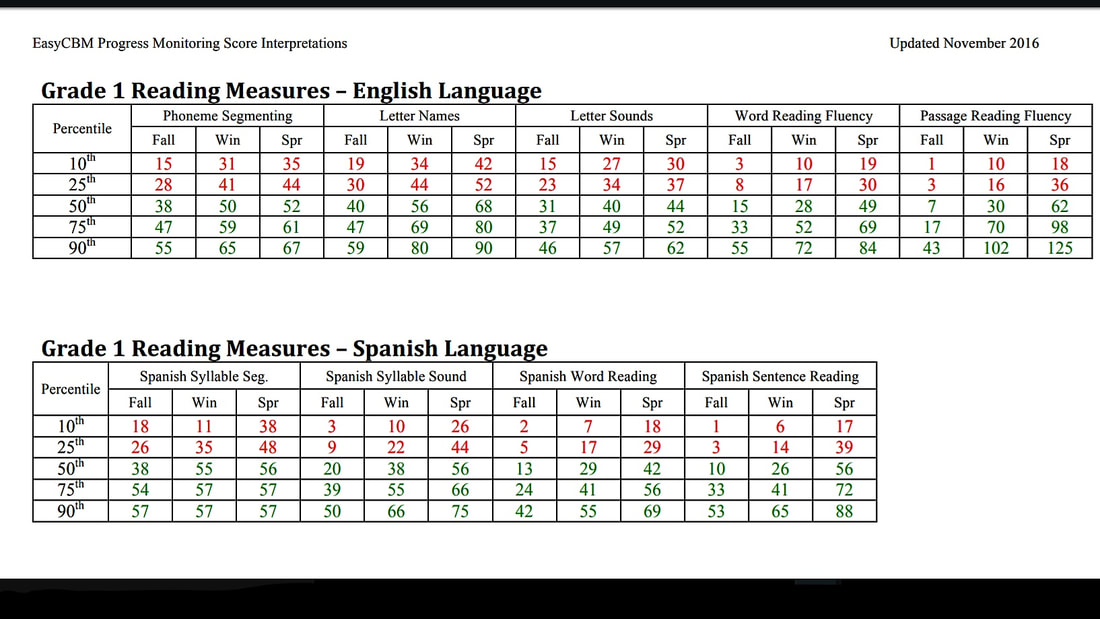
easyCBM Scoring Chart #2
The second scoring chart organizes the assessments based on the numeral value of each assessment and correlates it with the percentile ranking. The chart lists each measured section of the first grade easyCBM assessment, including phoneme segmenting, letter names, letter sounds, word reading fluency, and passage reading fluency and divides the section in fall, winter, and spring testing windows. The assessment illustrates the determined growth for each percentile ranking overtime. The scores in the 10th and 25th percentile are red and the scores in the 50th percentile above are green. By color coding the values in the chart the scoring chart is indicating that our goal as educators for students is to score in the 50th percentile or above the easyCBM assessment for each section measured.
Beginning of the Year easyCBM Reading Assessment (BOY)
The beginning of the year overall reading readiness for each student is determined by the combination of each individual reading skill assessment, including letter sounds, word reading fluency and phoneme segmenting. The amalgamation of each skill generates an overall reading readiness score, which demonstrates low, some or high risk. The scores for each student for the beginning of the year easyCBM assessments are displayed below.
The pie chart visually summarizes the easyCBM beginning of the year overall reading readiness for the 2015-2016 school year, creating a three tiered class profile based upon each student's risk assessment. Accordingly the pie chart shows that 27 students demonstrate low risk (on or above grade level), 5 students demonstrate some risk (less than one grade level below), 1 student demonstrates high risk (below grade level) for overall reading readiness.
Middle of the Year easyCBM Reading Assessment (MOY)
The middle of the year overall reading readiness for each student is determined by the combination of each individual reading skill assessment, including letter sounds, word reading fluency and phoneme segmenting. The amalgamation of each skill generates an overall reading readiness score, which demonstrates low, some or high risk. The scores for each student for the middle of the year easyCBM assessments are displayed below.
The pie chart visually summarizes the easyCBM middle of the year overall reading readiness for the 2015-2016 school year, creating a three tiered class profile based upon each student's risk assessment. Accordingly the pie chart shows that 22 students demonstrate low risk (on or above grade level), 9 students demonstrate some risk (less than one grade level below), 5 student demonstrates high risk (below grade level) for overall reading readiness.
End of the Year easyCBM Assessment (EOY)
The end of the year overall reading readiness for each student is determined by the combination of each individual reading skill assessment, including letter sounds, word reading fluency and phoneme segmenting. The amalgamation of each skill generates an overall reading readiness score, which demonstrates low, some or high risk. The scores for each student for the end of the year easyCBM assessments are displayed below.
The pie chart visually summarizes the easyCBM end of the year overall reading readiness for the 2015-2016 school year, creating a three tiered class profile based upon each student's risk assessment. Accordingly the pie chart shows that 27 students demonstrate low risk (on or above grade level), 5 students demonstrate some risk (less than one grade level below), 2 students demonstrate high risk (below grade level) for overall reading readiness.
